Agriculture: crop health & yield with satellite data
Find the right optical data, compute a vegetation index (NDVI), and turn it into a field-level map you can act on.
Search “agriculture”
Type your need in the search box. You land on a topic page listing every dataset with imagery relevant to agriculture.
Compare datasets
Filter by Free/Paid and category. For crops, Sentinel-2 (10 m, free) is the go-to; PlanetScope (3 m, daily) adds frequency.
Inspect the dataset
Open a dataset to check resolution, revisit, license and real sample imagery, and set your area of interest (AOI).
Get the data
Download open data for free, or pull it programmatically via the JSON API (/api/dataset/sentinel-2).
Compute NDVI
NDVI = (NIR − Red) / (NIR + Red). Use the analysis-ready NDVI product, or compute it from raw bands. Low values flag stressed crops.
Deliver the map
Export the NDVI layer to GIS/BI as GeoTIFF and share a field-level map for scouting and variable-rate application.
Qué obtienes
A field-level NDVI map highlighting crop-stress zones for variable-rate management.
Conjuntos de datos recomendados
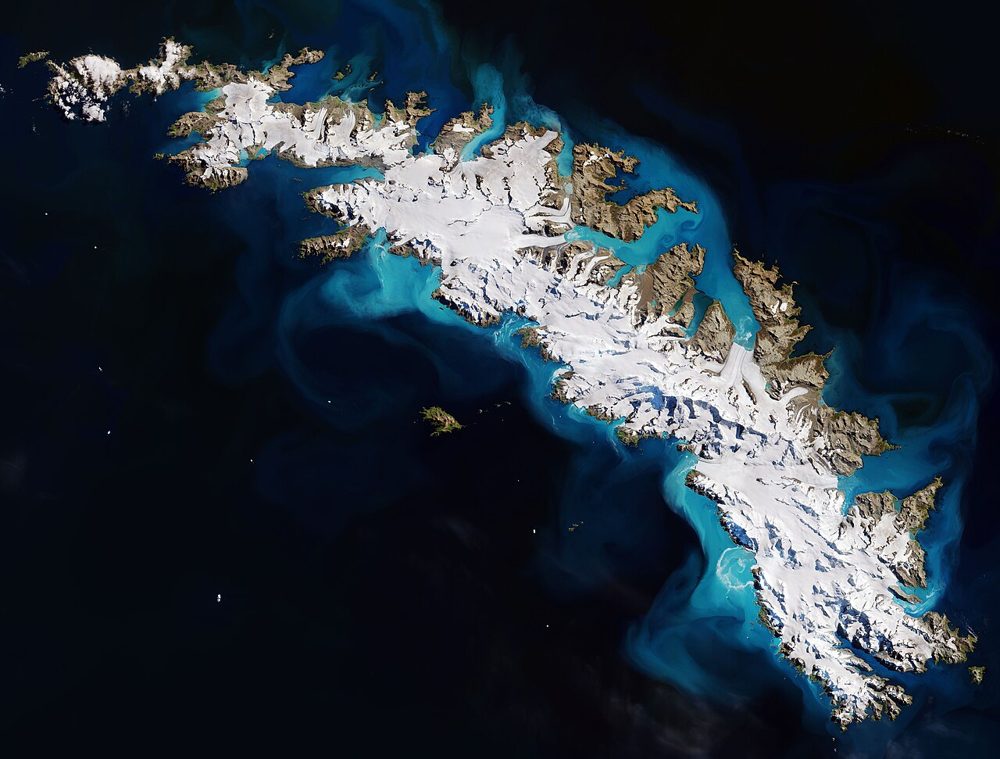
Sentinel-2 (Optical, Multispectral)
ESA / Copernicus
The optical satellite of ESA's Copernicus Earth-observation programme. Its 13-band multispectral data is the most widely used free source for vegetation indices (NDVI), water detection and land-cover analysis.
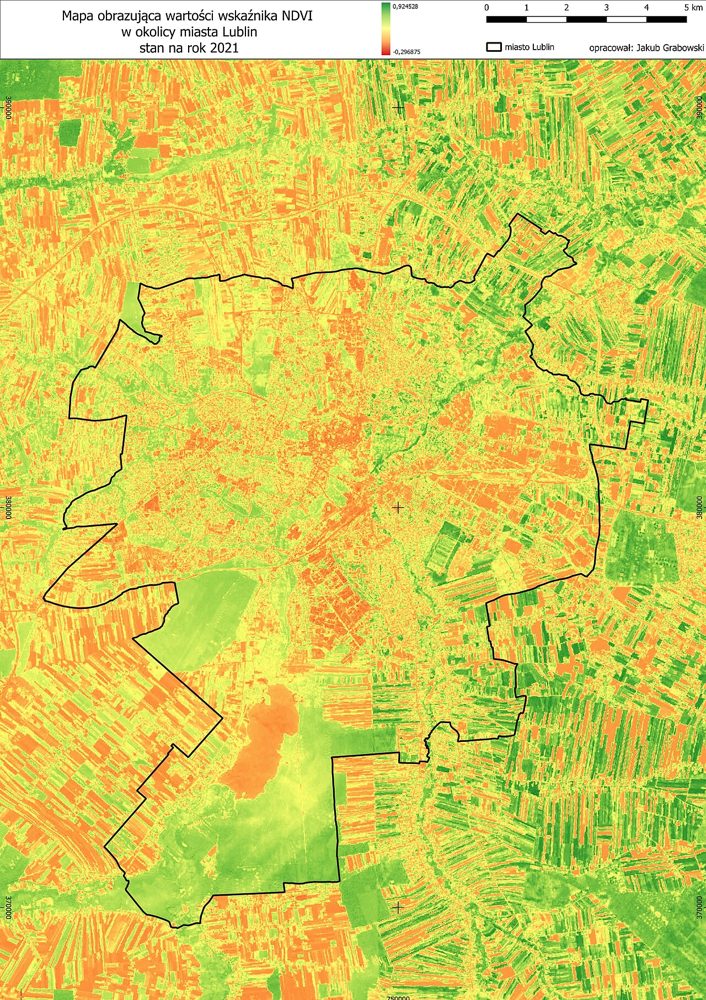
Sentinel-2 Derived Vegetation Index Product (Analysis-ready)
SatelliteData.org Analytics Lab
An NDVI/NDWI time-series product pre-computed by us from raw Sentinel-2 data. Because it is already processed, you can download it and use it immediately in GIS or BI tools.
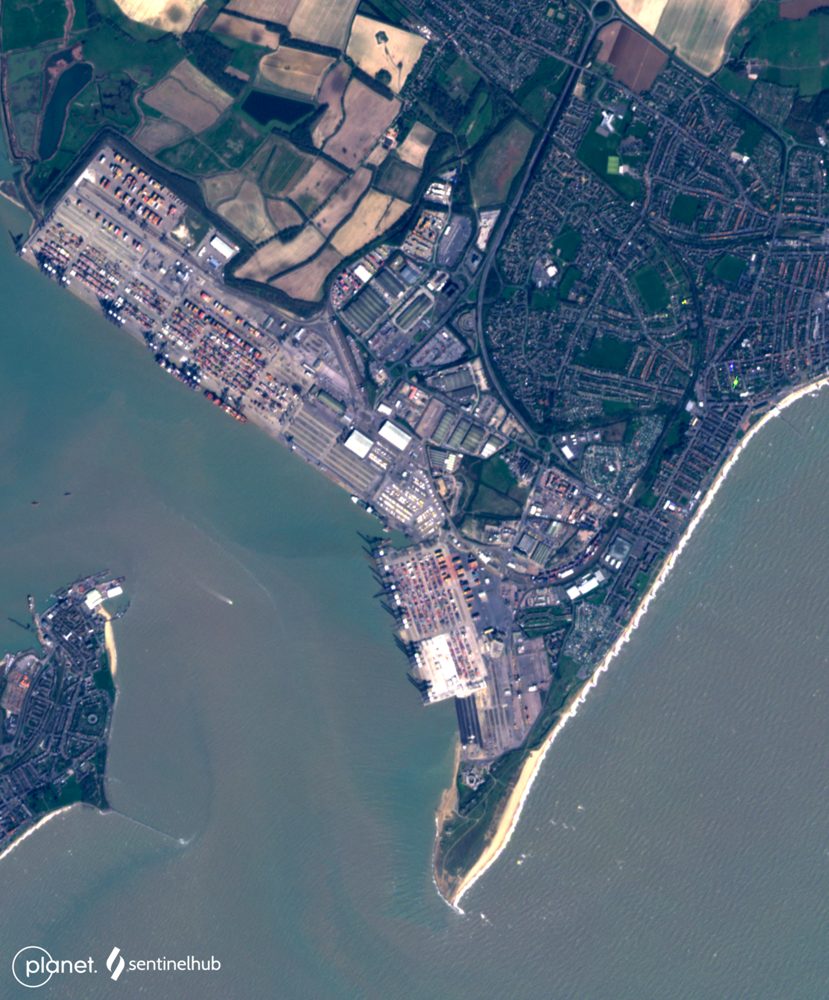
PlanetScope (3 m, near-daily)
Planet Labs PBC
A constellation of roughly 130 microsatellites images the entire land surface almost every day. Ideal when you cannot afford to miss any change—construction progress or anomaly detection on farmland.
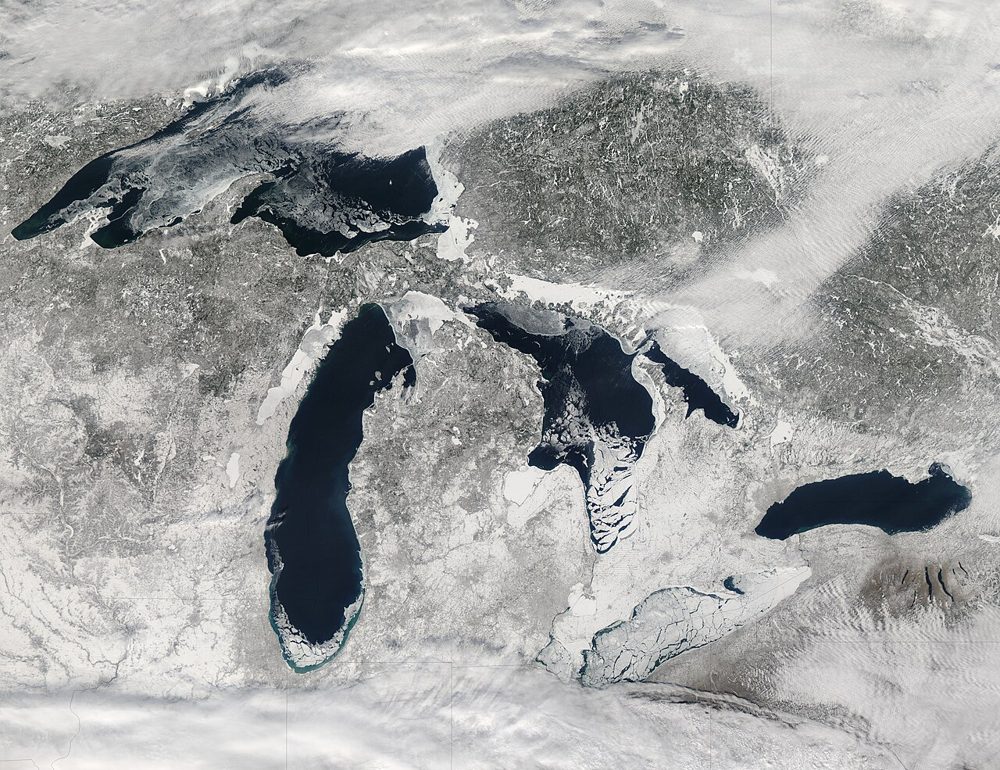
MODIS (Terra/Aqua)
NASA
A 36-band wide-swath sensor. Though coarse in resolution, it covers the entire globe almost daily and is the workhorse for large-scale vegetation, fire and ocean-color monitoring, with a rich set of standard products.